Decision-Grade Evidence for Conditions
Site-based approaches are slow, expensive, and incomplete — and claims or EHR data can't handle complex questions. PicnicResearch's evidence platform uses a patient-mediated approach to generate fit-for-purpose evidence faster and at lower cost, capturing retrospective record depth, prospective follow-up, and patient-generated data in a single living data asset.
Answer the questions that matter most
Access a scientifically informed, living data asset that adapts as your evidence needs evolve.
Disease burden and quality of life impact
Patient journey and experience
Treatment patterns, burden, and tolerability
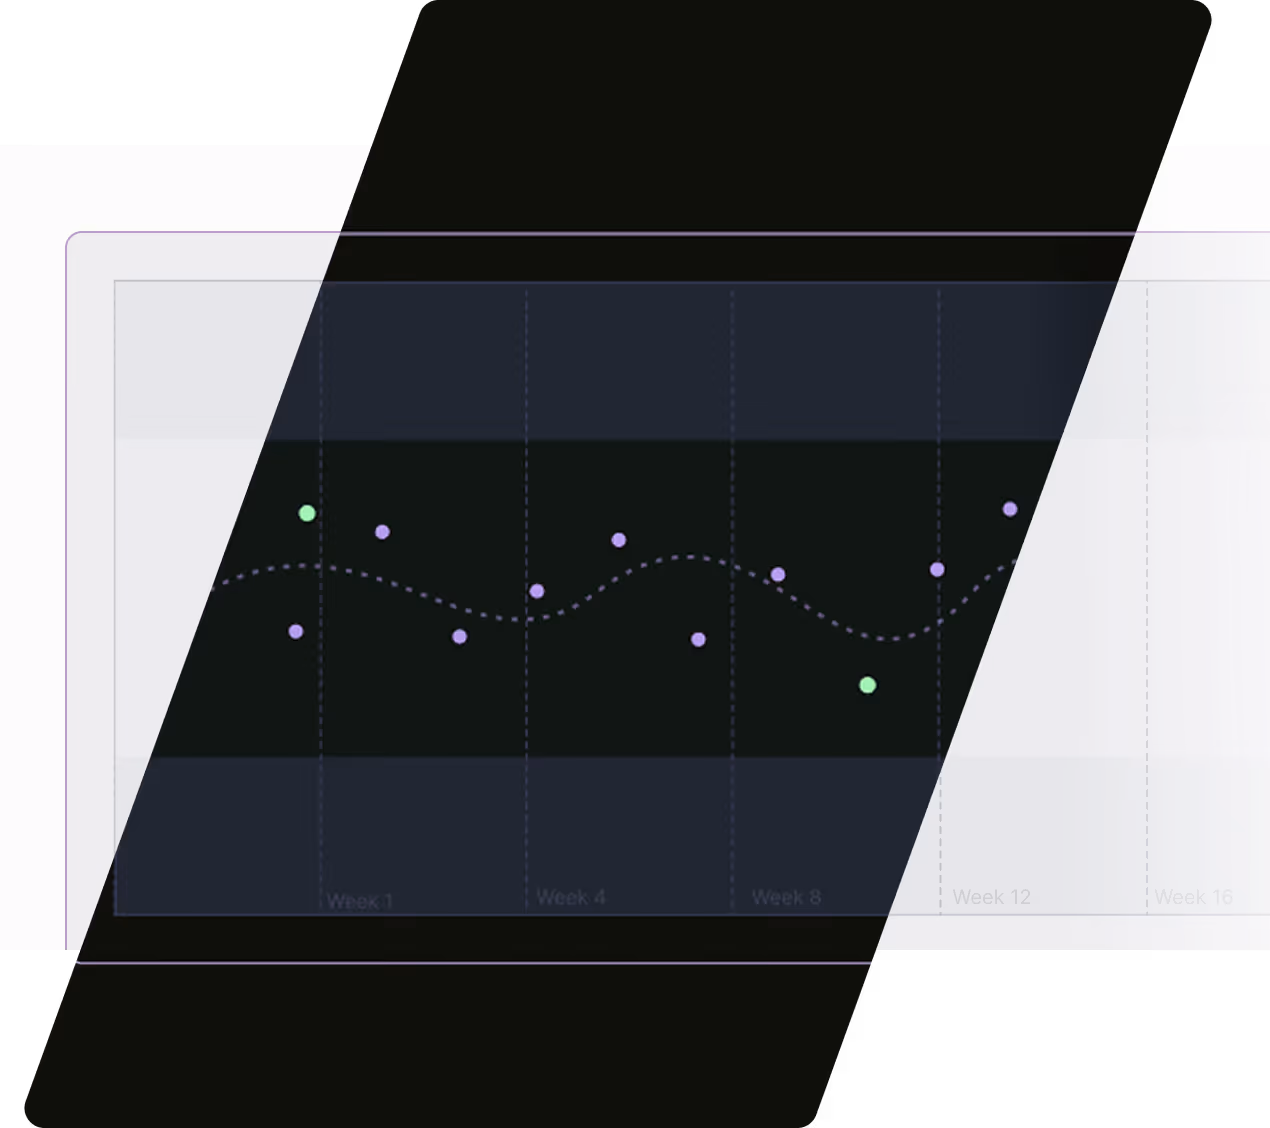
Natural history and disease progression
Unmet need and gaps in current care
The strategic solution for condition research
of CONDITION studies
enroll on track with enrollment forecast
more cost-effective
than site-based models
What makes our approach different?
Designed for precision & flexibility
Every element of study design, protocol, and data collection is tailored to your specific endpoints and research objectives. As your program evolves, our flexible data model accommodates emerging research questions without costly protocol amendments or structural redesign.
Informed by complete patient journeys
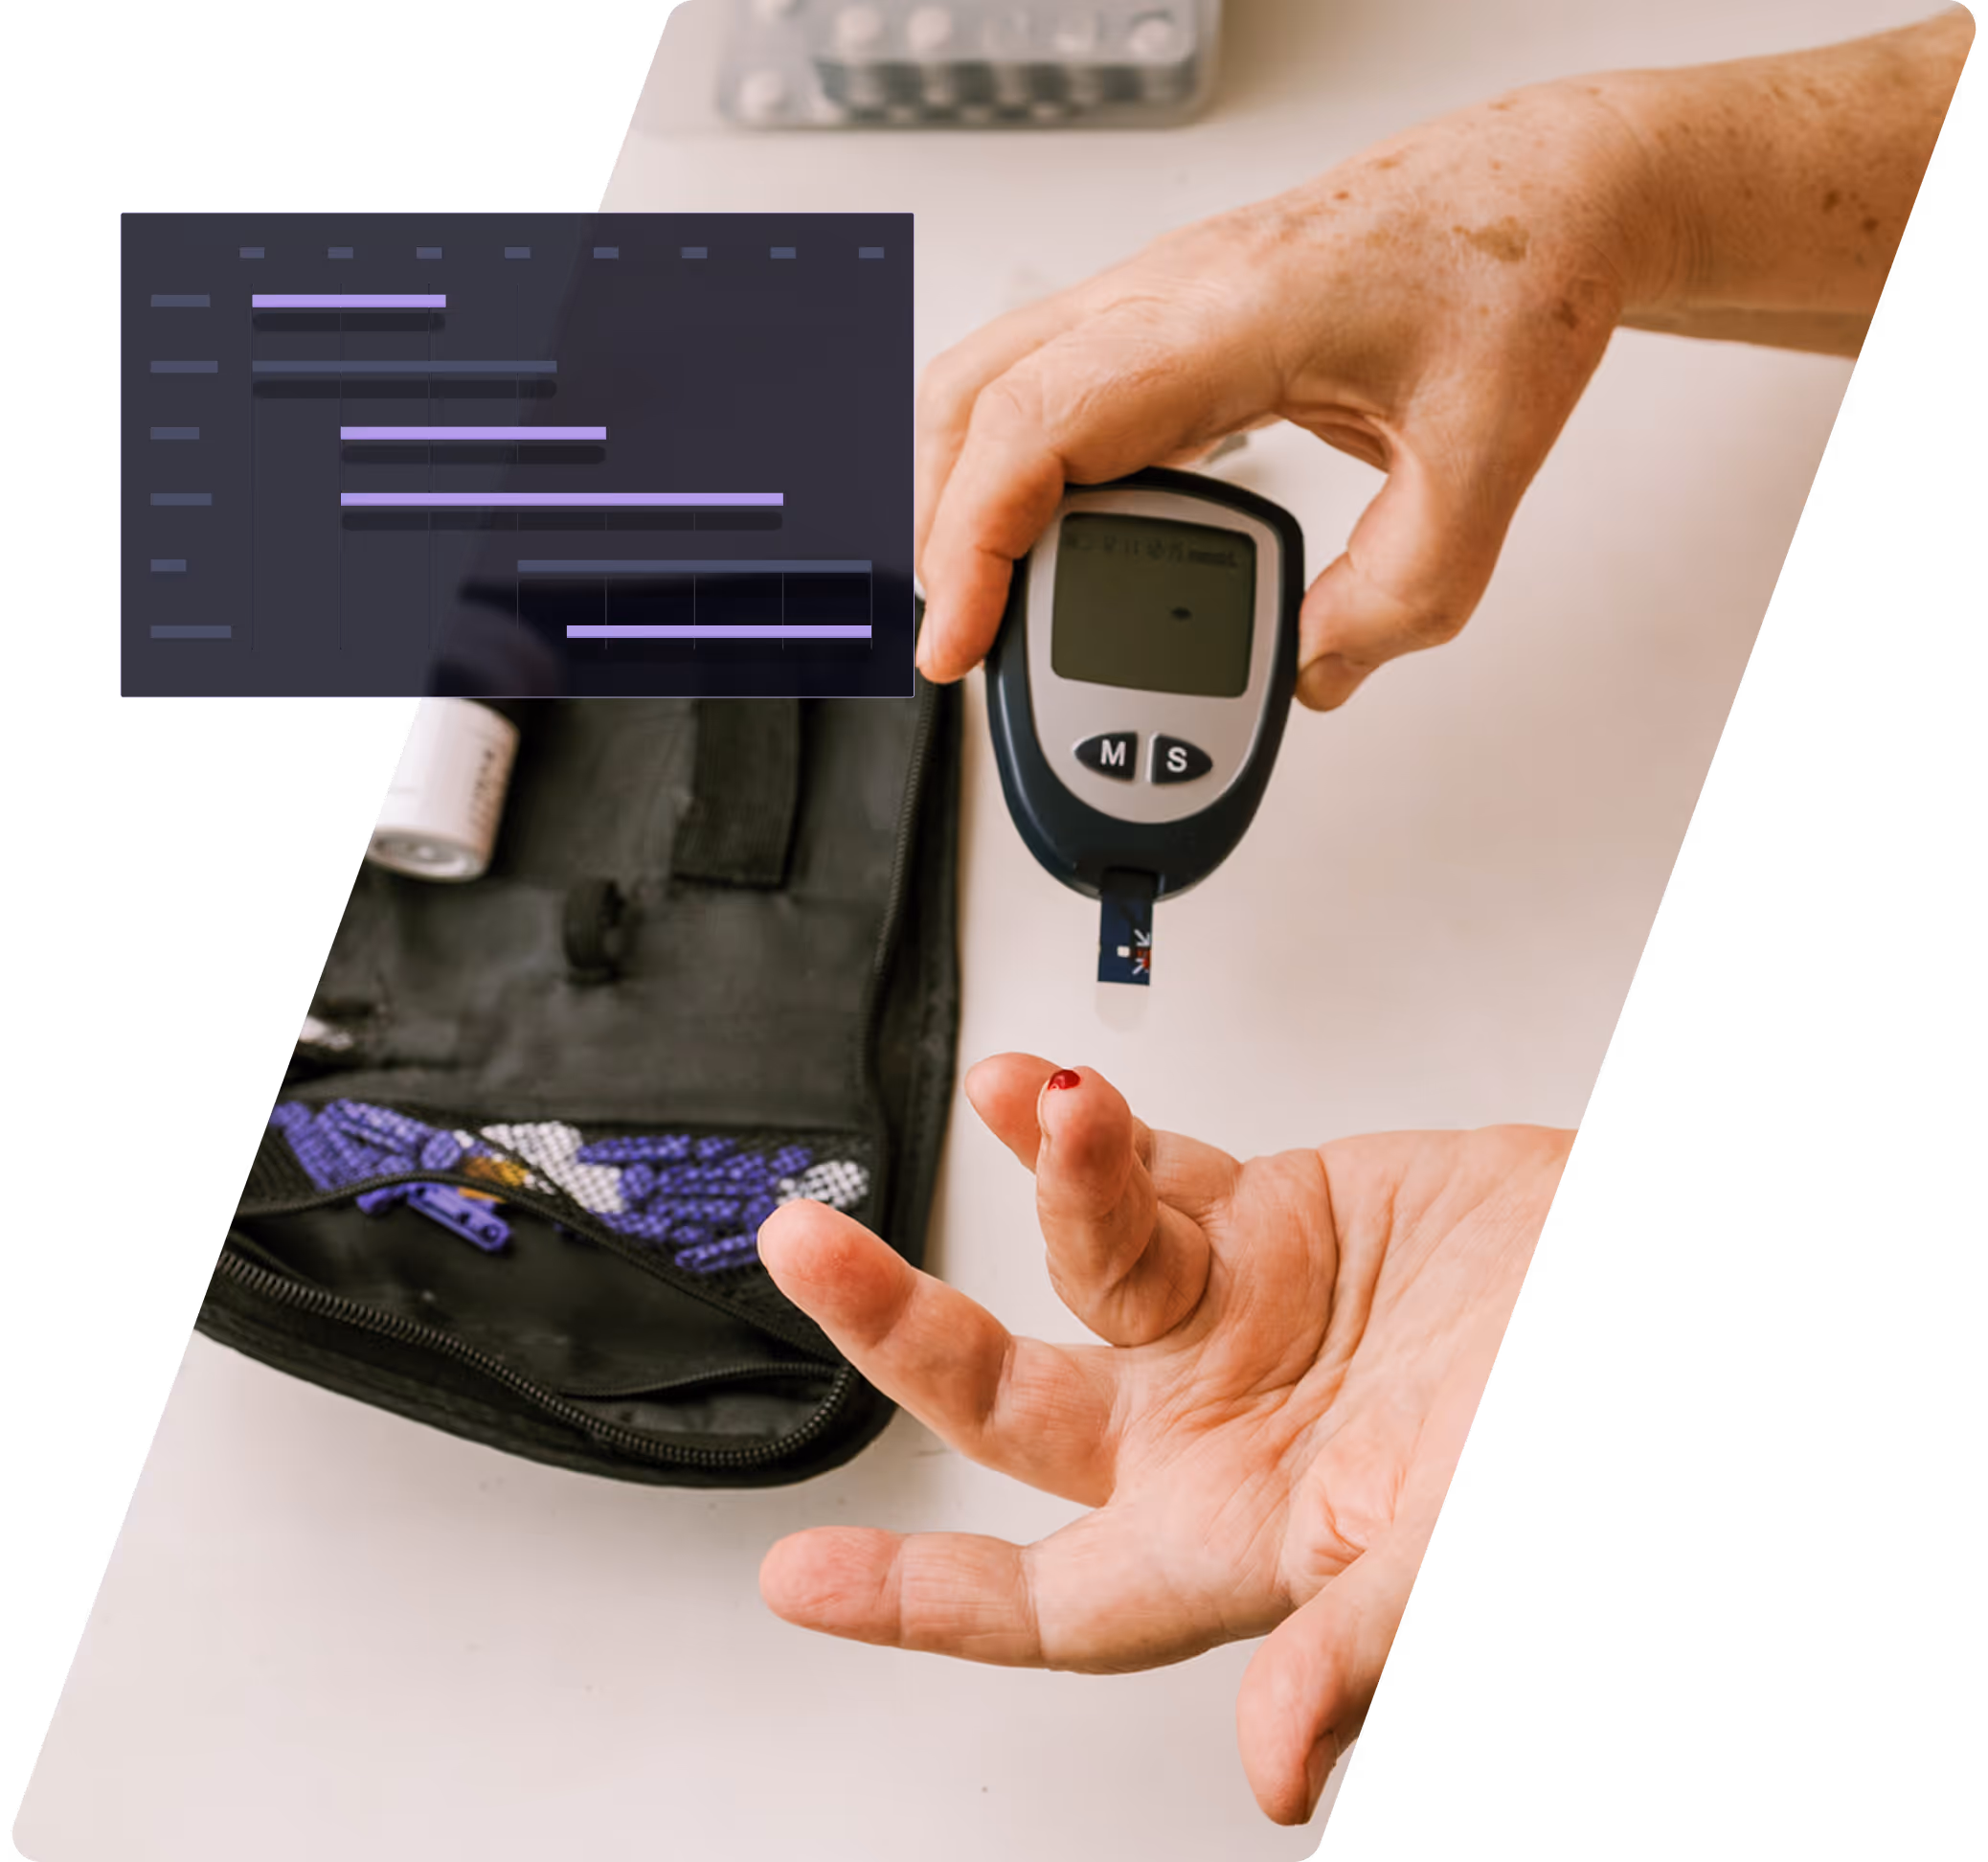
Our patient-mediated approach and AI-powered platform capture complete retrospective patient histories and continuous prospective data across all sites of care, building the longitudinal depth that complex research questions require. Patients can also contribute patient-generated data through PROs, surveys, and wearables, and access tools that support their own care journey.

Built for the complexity of rare disease
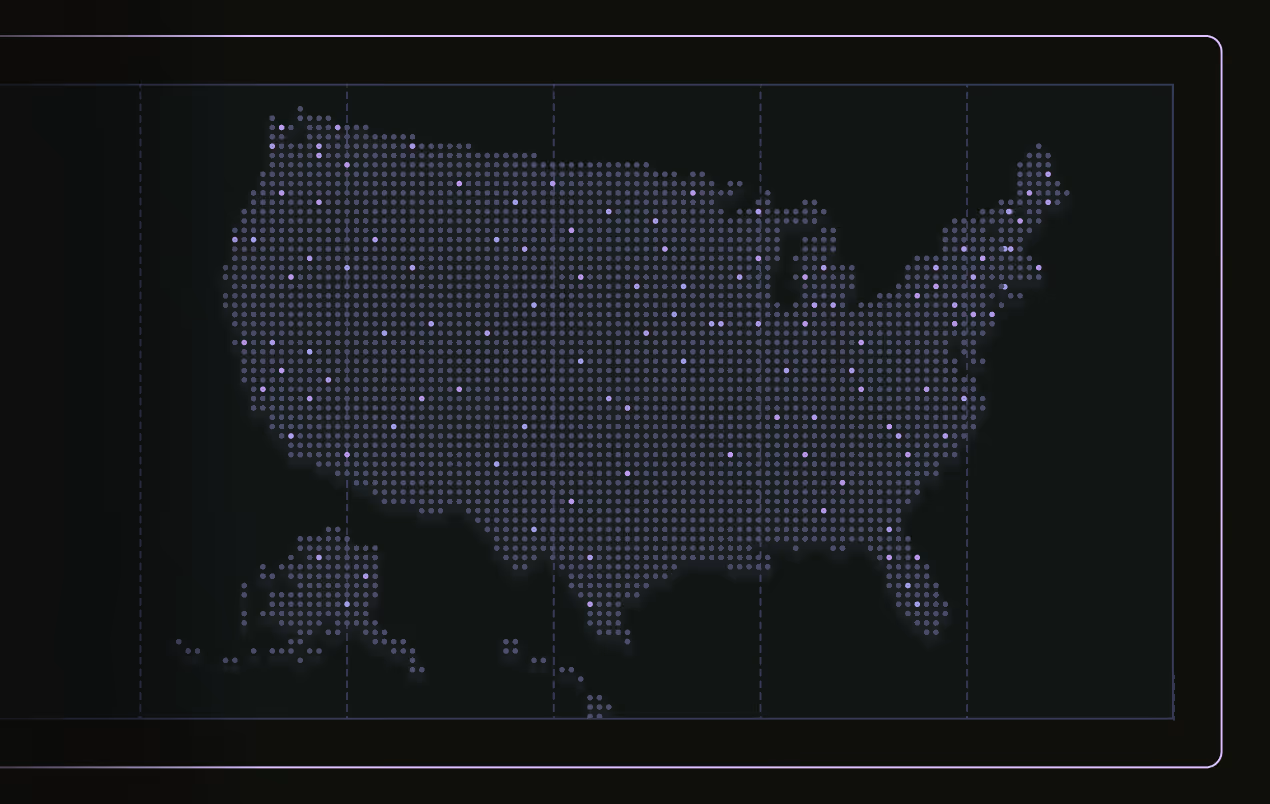
Designed for representative evidence, PicnicResearch’s site-agnostic approach reaches rare and ultra-rare disease patients wherever they are, reducing the burden of participation and keeping them engaged throughout your study.
Delivering end-to-end visibility
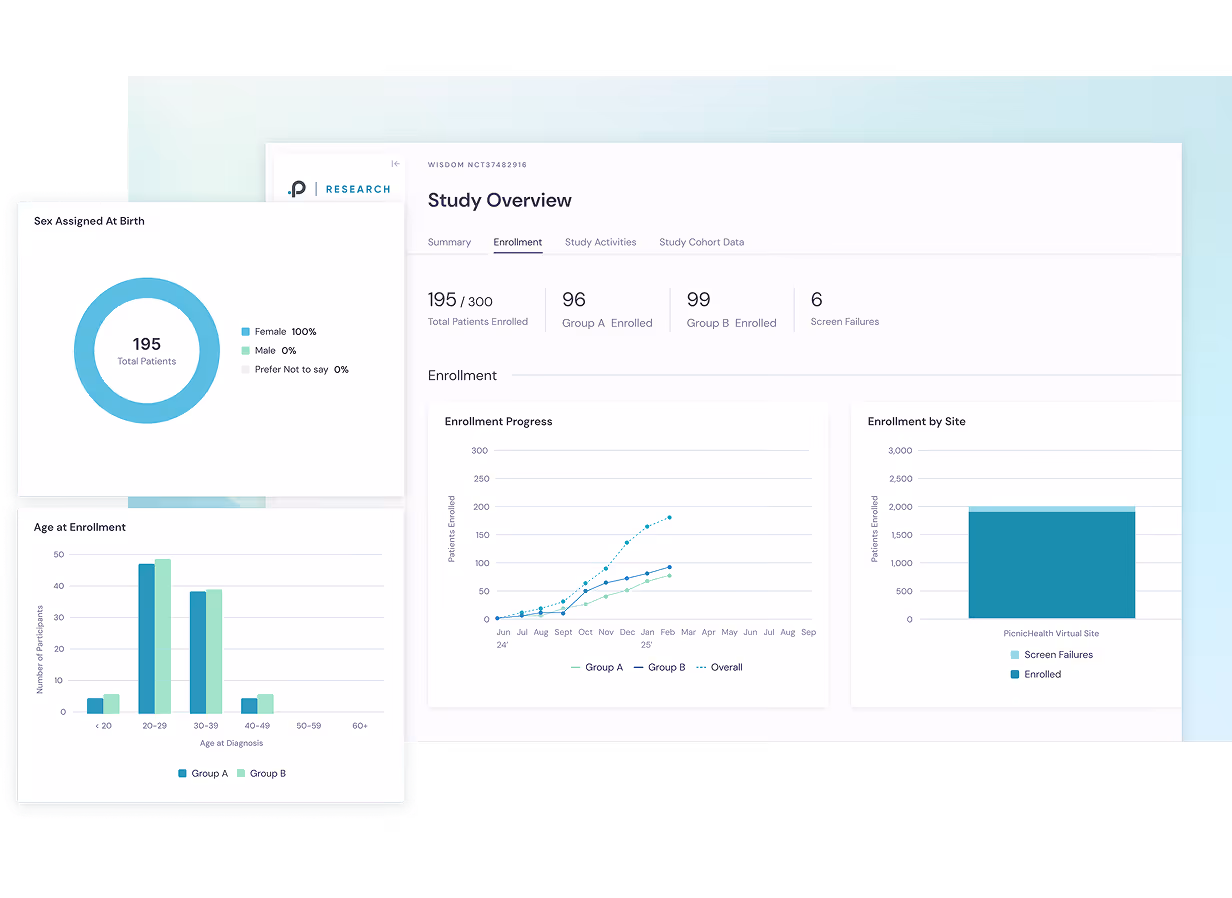
Make more informed decisions with real-time visuals delivered through our sponsor portal. Track enrollment progress, participant representation, and survey responses — then at data delivery, receive enhanced visualizations across all variables relevant to your study objectives.
Get in touch with our team.
Fill out the form, and one of our experts will contact you for an introductory call.